Chapter 11
Profiling Processing Resources [#]
11.1 Overview [#]
This is a reporting tool for GATE processing resources. It reports the total time taken by processing resources and the time taken for each document to be processed by an application of type corpus pipeline.
GATE use log4j, a logging system, to write profiling informations in a file. The GATE profiling reporting tool uses the file generated by log4j and produces a report on the processing resources. It profiles JAPE grammars at the rule level, enabling the user precisely identify the performance bottlenecks. It also produces a report on the time taken to process each document to find problematic documents.
This initial code for the reporting tool was written by Intelius employees Andrew Borthwick and Chirag Viradiya and generously released under the LGPL licence to be part of GATE.
11.1.1 Features
-
Ability to generate the following two reports
-
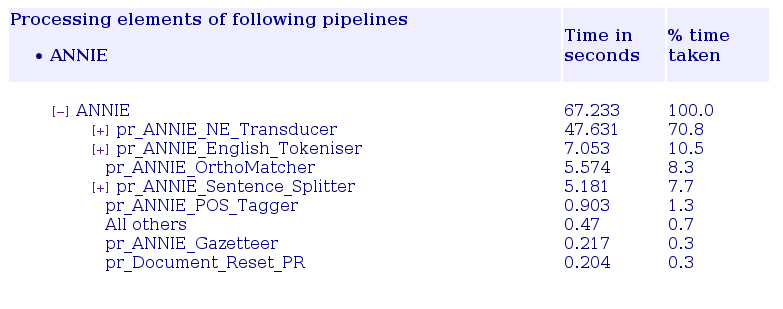
Report on processing resources. For each level of processing: application, processing resource (PR) and grammar rule, subtotalled at each level.
-
Report on documents processed. For some or all PR, sorted in decreasing processing time.
-
-
Report on processing resources specific features
-
Sort order by time or by execution.
-
Show or hide processing elements which took 0 milliseconds.
-
Generate HTML report with a collapsible tree.
-
-
Report on documents processed specific features
-
Limit the number of document to show from the most time consuming.
-
Filter the PR to display statistics for.
-
-
Features common to both reports
-
Generate report as indented text or in HTML format.
-
Generate a report only on the log entries from the last logical run of GATE.
-
All processing times are reported in milliseconds and in terms of percentage (rounded to nearest 0.1%) of total time.
-
Command line interface and API.
-
Detect if the benchmark.txt file is modified while generating the report.
-
11.1.2 Limitations
Be aware that the profiling doesn’t support non corpus pipeline as application type. There is indeed no interest in profiling a non corpus pipeline that works on one or no document at all. To get meaningful results you should run your corpus pipeline on at least 10 documents.
11.2 Graphical User Interface [#]
The activation of the profiling and the creation of profiling reports are accessible from the ‘Tools’ menu in GATE with the submenu ‘Profiling Reports’.
You can ‘Start Profiling Applications’ and ‘Stop Profiling Applications’ at any time. The logging is cumulative so if you want to get a new report you must use the ‘Clear Profiling History’ menu item when the profiling is stopped.
Be very careful that you must start the profiling before you load your application or you will need to reload every Processing Resource that uses a Transducer. Otherwise you will get an Exception similar to:
java.lang.IndexOutOfBoundsException: Index: 2, Size: 0
at java.util.ArrayList.RangeCheck(ArrayList.java:547)
at java.util.ArrayList.get(ArrayList.java:322)
at gate.jape.SinglePhaseTransducer.updateRuleTime(SinglePhaseTransducer.java:678)
Two types of reports are available: ‘Report on Processing Resources’ and ‘Report on Documents Processed’. See the previous section for more information.
11.3 Command Line Interface [#]
Report on processing resources Usage: java gate.util.reporting.PRTimeReporter [Options]
Options:
-i input file path (default: benchmark.txt in the user’s .gate directory1)
-m print media - html/text (default: html)
-z suppressZeroTimeEntries - true/false (default: true)
-s sorting order - exec_order/time_taken (default: exec_order)
-o output file path (default: report.html/txt in the system temporary directory)
-l logical start (not set by default)
-h show help
Note that suppressZeroTimeEntries will be ignored if the sorting order is ‘time_taken’
Report on documents processed Usage: java gate.util.reporting.DocTimeReporter [Options]
Options:
-i input file path (default: benchmark.txt in the user’s .gate directory2)
-m print media - html/text (default: html)
-d number of docs, use -1 for all docs (default: 10 docs)
-p processing resource name to be matched (default: all_prs)
-o output file path (default: report.html/txt in the system temporary directory)
-l logical start (not set by default)
-h show help
-
Run report 1: Report on Total time taken by each processing element across corpus
-
java -cp "gate/bin:gate/lib/GnuGetOpt.jar" gate.util.reporting.PRTimeReporter -i benchmark.txt -o report.txt -m text
-
-
Run report 2: Report on Time taken by document within given corpus.
-
java -cp "gate/bin:gate/lib/GnuGetOpt.jar" gate.util.reporting.DocTimeReporter -i benchmark.txt -o report.html -m html
-
11.4 Application Programming Interface [#]
11.4.1 Log4j.properties
This is required to direct the profiling information to the benchmark.txt file. The benchmark.txt generated by GATE will be used as input for GATE profiling report tool as input.
-
# File appender that outputs only benchmark messages
-
log4j.appender.benchmarklog=org.apache.log4j.RollingFileAppender
-
log4j.appender.benchmarklog.Threshold=DEBUG
-
log4j.appender.benchmarklog.File=$user.home/.gate/benchmark.txt
-
log4j.appender.benchmarklog.MaxFileSize=5MB
-
log4j.appender.benchmarklog.MaxBackupIndex=1
-
log4j.appender.benchmarklog.layout=org.apache.log4j.PatternLayout
-
log4j.appender.benchmarklog.layout.ConversionPattern=%m%n
-
# Configure the Benchmark logger so that it only goes to the benchmark log file
-
log4j.logger.gate.util.Benchmark=DEBUG, benchmarklog
-
log4j.additivity.gate.util.Benchmark=false
11.4.2 Benchmark log format
The format of the benchmark file that logs the times is as follow:
timestamp START PR_name
timestamp duration benchmarkID class features
timestamp duration benchmarkID class features
...
with the timestamp being the difference, measured in milliseconds, between the current time and midnight, January 1, 1970 UTC.
Example:
1257269774770 START Sections_splitter
1257269774773 0 Sections_splitter.doc_EP-1026523-A1_xml_00008.documentLoaded
gate.creole.SerialAnalyserController
{corpusName=Corpus for EP-1026523-A1.xml_00008,
documentName=EP-1026523-A1.xml_00008}
...
11.4.3 Enabling profiling
There are two ways to enable profiling of the processing resources:
-
In gate/build.properties, add the line: run.gate.enable.benchmark=true
-
In your Java code, use the method: Benchmark.setBenchmarkingEnabled(true)
11.4.4 Reporting tool
Report on processing resources
-
Instantiate the Class PRTimeReporter
-
PRTimeReporter report = new PRTimeReporter();
-
-
Set the input benchmark file
-
File benchmarkFile = new File("benchmark.txt");
-
report.setBenchmarkFile(benchmarkFile);
-
-
Set the output report file
-
File reportFile = new File("report.txt"); or
-
File reportFile = new File("report.html");
-
report.setReportFile(reportFile);
-
-
Set the output format: in html or text format (default: MEDIA_HTML)
-
report.setPrintMedia(PRTimeReporter.MEDIA_TEXT); or
-
report.setPrintMedia(PRTimeReporter.MEDIA_HTML);
-
-
Set the sorting order: Sort in order of execution or descending order of time taken (default: EXEC_ORDER)
-
report.setSortOrder(PRTimeReporter.SORT_TIME_TAKEN); or
-
report.setSortOrder(PRTimeReporter.SORT_EXEC_ORDER);
-
-
Set if suppress zero time entries: True/False (default: True). Parameter ignored if SortOrder specified is ‘SORT_TIME_TAKEN’
-
report.setSuppressZeroTimeEntries(true);
-
-
Set the logical start: A string indicating the logical start to be operated upon for generating reports
-
report.setLogicalStart("InteliusPipelineStart");
-
-
Generate the text/html report
-
report.executeReport();
-
-
Instantiate the Class DocTimeReporter
-
DocTimeReporter report = new DocTimeReporter();
-
-
Set the input benchmark file
-
File benchmarkFile = new File("benchmark.txt");
-
report.setBenchmarkFile(benchmarkFile);
-
-
Set the output report file
-
File reportFile = new File("report.txt"); or
-
File reportFile = new File("report.html");
-
report.setReportFile(reportFile);
-
-
Set the output format: Generate report in html or text format (default: MEDIA_HTML)
-
report.setPrintMedia(DocTimeReporter.MEDIA_TEXT); or
-
report.setPrintMedia(DocTimeReporter.MEDIA_HTML);
-
-
Set the maximum number of documents: Maximum number of documents to be displayed in the report (default: 10 docs)
-
report.setNoOfDocs(2); // 2 docs or
-
report.setNoOfDocs(DocTimeReporter.ALL_DOCS); // All documents
-
-
Set the PR matching regular expression: A PR name or a regular expression to filter the results (default: MATCH_ALL_PR_REGEX).
-
report.setSearchString("HTML"); // match ALL PRS having HTML as substring
-
-
Set the logical start: A string indicating the logical start to be operated upon for generating reports
-
report.setLogicalStart("InteliusPipelineStart");
-
-
Generate the text/html report
-
report.executeReport();
-
1GATE versions up to 5.2 placed benchmark.txt in the execution directory.
2GATE versions up to 5.2 placed benchmark.txt in the execution directory.
